Validated — not standalone Event-driven US equities Long-only 2018–2026

PEAD — Post-Earnings
Announcement Drift

Buy US small/mid caps that beat consensus EPS by ≥10% and hold for 90 trading days. The classic “concordant” reaction-day filter adds nothing; the real, statistically significant edge is surprise magnitude.

Edge statistically real: +0.97pp/60d, p = 0.0001 Underperforms equal-weight buy & hold
+70.5%
Best config · 8.6y
90d hold · ≥$2M ADV · >10% beat · portfolio model
1.29
Profit factor
Best config, after 10bps costs
+0.97pp
Edge / 60 days
vs universe baseline · p = 0.0001 · n = 11,858
909
R2000 names
27.5k earnings events · survivorship-free

Verdict

The PEAD magnitude effect is real and statistically significant on US small/mid caps: buying stocks whose EPS beats consensus by ≥10% earns ~+0.97pp per 60 days over the universe baseline (p = 0.0001, n = 11,858 on the broad Russell 2000; +3.40pp, p = 0.002 on curated small caps).

However, in a realistic concurrent-portfolio model the best configuration returns +70.5% over 8.6 years (PF 1.29) — while simply buying the same universe equal-weight returned +120% (buy & hold) or +799% (daily rebalanced). The differential is real; the market beta eats it. Use as a portfolio tilt or an alpha overlay, not a standalone book.

What PEAD claims

The anomaly

Post-Earnings Announcement Drift (Bernard & Thomas 1989) is the observation that stock prices continue to drift in the direction of an earnings surprise for weeks after the announcement, instead of adjusting instantly. The academic effect is strongest in smaller, less-covered stocks.

The popular rule (from the original transcript)

The widely-circulated rule trades “concordant” events only: a beat that also rose on announcement day (long) or a miss that fell (short), entered at the next session’s open with a 60-trading-day hold.

What the backtest actually found

The concordant reaction-day filter adds no value — and loses money in the realistic portfolio model at every holding period. On small caps, beats that fell on announcement day had higher 60-day forward returns than beats that rose (reaction-day mean reversion).

The surviving edge

Surprise magnitude. Monotonic in the beat size: 0–2% → +1.95%, 2–5% → +1.02%, 5–10% → +5.08%, >10% → +8.12% per 60 days on small caps. Only the >10% bucket is statistically significant. This is the classic, academically-documented PEAD magnitude effect.

The exact rules that survived

Best configuration found across all tested variants (R2000 expanded universe).

ComponentRuleNotes
UniverseUS Russell 2000 (point-in-time Jan-2016 snapshot)909 of 1,909 names had data; 862 delisted names excluded by design (survivorship guard)
Liquidity filterAverage daily volume ≥ $2M22,113 of 26,674 events pass
SignalReported EPS beats consensus by ≥ 10%Surprise = actual vs pre-announcement analyst consensus (Yahoo)
DirectionLong onlyShort side (miss + down) has significant differential (−3.18pp, p=0.035) but poor absolute economics — hedge only
EntryOpen of next trading session after announcementReaction window uses only prices known before entry — no lookahead
Hold90 trading days (30 / 45 / 60 / 90 tested)90d best; 60d per Bernard & Thomas
ExitClose of the Nth trading dayNo stops, no intermediate exits in the basic version
Sizing10% of equity per signal, max gross exposure 100%Capacity-aware: min(pos% × equity, equity − committed)
Costs10 bps round-trip baselineSurvives 20 bps; profit factor < 1 at 50 bps
Rule that was tested and rejected: the concordant filter (beat + price up / miss + price down). Large caps: +0.05pp over baseline (p = 0.93). Small caps: +0.18pp (p = 0.84). Adding the reaction-day condition to the magnitude signal reduces performance in the portfolio model.

Where the edge does and doesn’t exist

MarketEdgeEvidenceVerdict
US small/mid caps (curated, 37 names)+3.40pp / 60dp = 0.002 · n = 462 · 61% win · PF 3.2 (gross, standalone)Strongest signal
US Russell 2000 (broad, 909 names)+0.97pp / 60dp = 0.0001 · n = 11,858Real but thin
US large / mega caps (45 names)+0.05pp / 60dp = 0.93 — no exploitable edge; all groups ≈ baseline betaNo edge
ASX large caps (13 names)+0.84pp / 60dp = 0.39 · every variant underperforms B&H of the same names (+104%)No edge
Short side (miss + down, small caps)−3.18pp / 60dp = 0.035 — significant differential, weak absolute economicsHedge only
Read: the edge scales inversely with market efficiency — strong on small caps, gone on mega-caps and ASX large caps. The R2000 result is statistically real but the broad-universe beta baseline (+3.14%/60d) is so high that the differential doesn’t translate into standalone returns.

Hold-period sweep (R2000, portfolio model)

Realistic concurrent portfolio with daily mark-to-market, 10 bps round-trip costs, $100k start, 2018-01-01 → 2026-08-27. Long-only >10% beats.

HoldTradesFinalTotal retCAGRMax DDWin ratePF
30d1,157$139,245+39.2%3.5%−41.0%49.1%1.08
45d881$142,638+42.6%3.7%−47.9%49.4%1.11
60d846$126,442+26.4%2.4%−41.4%54.4%1.08
90d812$170,532+70.5%5.6%−51.6%50.6%1.29

Cost sensitivity (60d hold, portfolio model)

Round-trip costNet returnProfit factorEdge status
0 bps+26.4%1.12Alive
10 bps+26.2%1.08Alive
20 bps+25.9%1.05Marginal
50 bps+25.2%0.96Dead (PF < 1)
Cost budget is the binding constraint. The per-event differential (~1pp over 60 days) leaves room for ~20 bps round-trip. Anyone paying 50 bps or more (small fills, market-on-close, retail commissions) should not trade this.

Equity curve — strategy vs universe benchmarks

Best public chart: 60d hold portfolio (the full R2000 results set also has a static PNG below). The strategy line is the big-beat long-only portfolio; benchmarks are equal-weight constructions of the same 909-name universe.

Big-beat >10% long (portfolio, 60d hold)
Equal-weight buy & hold
Equal-weight daily rebalanced

Final values (same window): strategy $126,442 (+26%) · buy & hold $219,897 (+120%) · daily rebalanced $899,434 (+799%). The +799% figure quoted in the source README corresponds to the daily-rebalanced series.
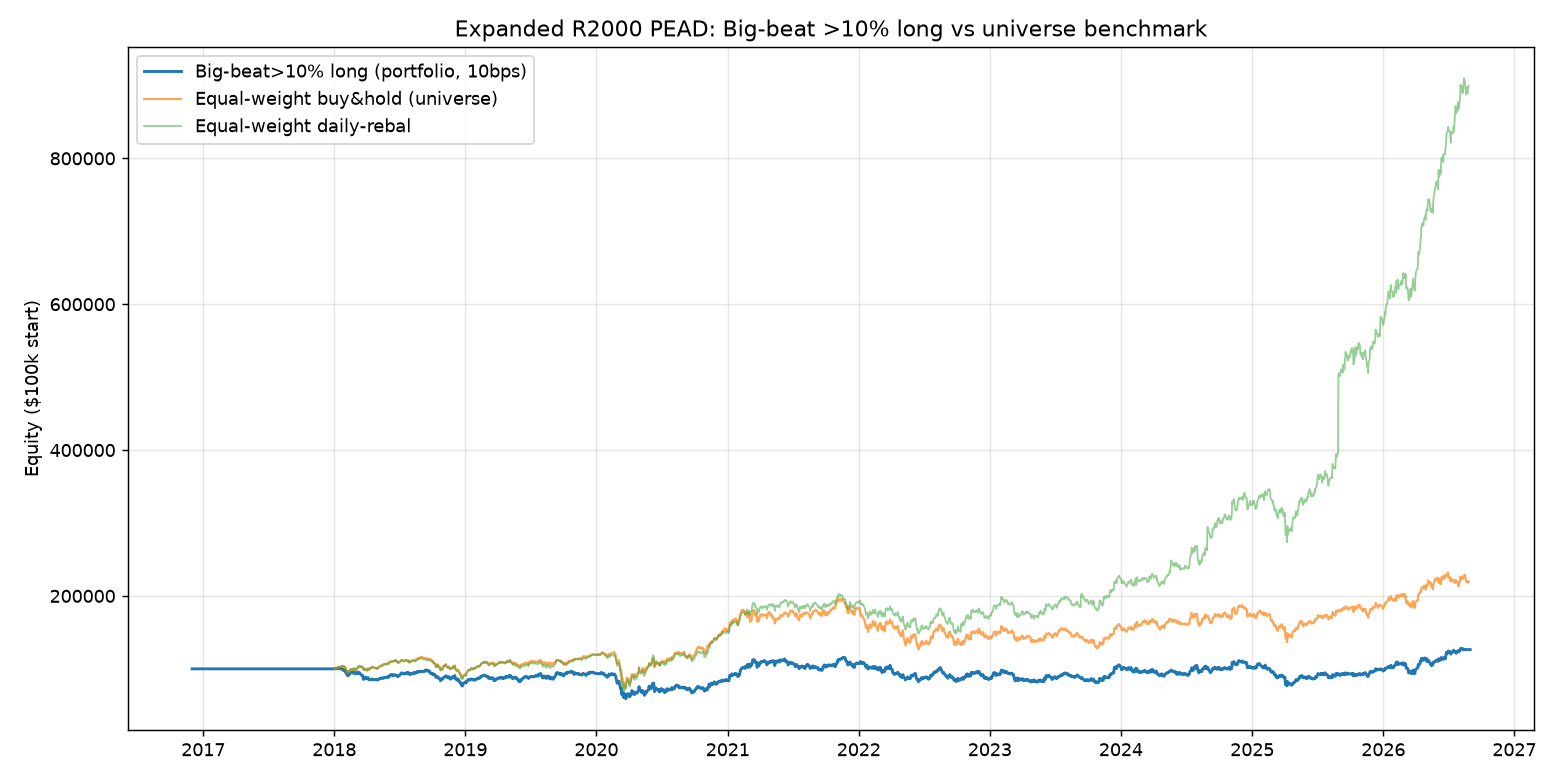
R2000 PEAD big-beat equity curve vs benchmark
Static chart produced by src/chart_r2000.py (matplotlib, 130 dpi).

Per-event differential vs baseline (gross, 60d forward returns)

The honest way to read a long-only backtest: compare each event group’s 60-day forward return against the universe baseline. Compounded dollar totals are leveraged-beta artifacts; these differentials are the signal.

US small/mid caps (baseline +4.72%/60d)

GroupnAvg 60dDiffp
beat >10% (LONG)462+8.12%+3.40pp0.002
beat 5–10%191+5.08%+0.37pp0.83
beat_up (concordant LONG)503+4.90%+0.18pp0.84
beat_down385+6.69%+1.98pp0.10
miss_down (concordant SHORT)188+1.54%−3.18pp0.035

US large/mega caps (baseline +4.21%/60d)

GroupnAvg 60dDiffp
beat_up (concordant LONG)651+4.26%+0.05pp0.93
beat_down592+3.68%−0.52pp0.36
beat >10%477+5.58%+1.38pp0.073
miss_down (concordant SHORT)149+4.36%+0.16pp0.91
Key insight: on small caps the magnitude buckets are monotonic (0–2% → +1.95%, 2–5% → +1.02%, 5–10% → +5.08%, >10% → +8.12%) but only the >10% bucket is significant. On large caps nothing clears significance — the concordant filter the original strategy is built on measures noise (p = 0.93).

How this was tested

Data (free, keyless)

  • Yahoo Finance via yfinance: analyst consensus EPS, reported EPS, surprise, BMO/AMC timing, daily OHLCV
  • Russell 2000 universe from a point-in-time Jan-2016 snapshot (survivorship-bias-free)
  • ASX: Market Index announcements API + results-PDF EPS extraction (pypdf)

No-lookahead guarantees

  • Consensus estimates verified pre-announcement (point-in-time)
  • Reaction measured only with prices known before entry
  • Entry at open of the session after the full reaction
  • All events processed in strict chronological order

Execution models

  • Fixed-fraction: 10% of initial equity per trade — honest upper bound, no compounding artifact
  • Portfolio: concurrent positions, daily mark-to-market, max exposure 100% — real economics
  • Cost models: commission + slippage + market impact, swept 0–50 bps round-trip
What the numbers do NOT mean: sequential/compounding models (10% of current equity per trade) produce absurd final equities ($217T at 12k trades) and are never quoted on this page. Any PEAD write-up that leads with seven-figure compounded dollars is reporting leveraged-beta compounding, not a PEAD edge.

Reasons to be skeptical

Beta is the main return driver

Unconditional 60-day forward returns on US mega-caps were +4.2% (≈ market beta). Every long rule compounds into large dollar figures; the differential vs baseline is the only honest signal.

Broad-universe edge is thin

At 909 names the >10%-beat edge thins to +0.97pp/60d vs +3.40pp on the curated 37. Statistical significance ≠ standalone investability.

Survivorship caveats

The R2000 universe is survivorship-free, but the curated 37-name small-cap set uses names alive today — likely overstates that leg.

Micro-cap execution reality

R2000 micro-caps gap, halt, and have missing days. Portfolio MTM uses as-of lookups; fill assumptions at 10bps are optimistic for the smallest names. Capacity is limited.

ASX leg is underpowered

13 names, 137 events, time-series (YoY) surprise instead of analyst consensus — the null result there is suggestive, not conclusive.

No regime analysis

Single 2018–2026 window dominated by a small-cap bull phase. Walk-forward framework exists in the repo but headline results are full-window.

Run it yourself

All evidence comes from jahrfm/pead. Data is regenerable from free keyless sources.

# build data (yfinance + Market Index API + PDF parsing)
pip install -r requirements.txt
python src/build_r2000_data.py      # Russell 2000 (point-in-time 2016 snapshot)
python src/build_us_data.py         # US large caps
python src/build_us_small_data.py   # US small caps
python src/build_au_data.py         # ASX

# run backtests
python src/run_r2000.py             # expanded R2000 (recommended)
python src/run_us_backtest.py       # US large/small
python src/run_au_backtest.py       # ASX
Artifacts: raw trades and equity CSVs in results/, full results JSON in results/us_r2000_results.json, 15k-word backtesting best-practices guide in docs/BACKTESTING_BEST_PRACTICES.md.

Academic basis

  1. Bernard, V. L., & Thomas, J. K. (1989). Post-earnings-announcement drift: delayed price response or risk premium? Journal of Accounting Research, 27(1), 1–36.
  2. Livnat, J., & Mendenhall, R. R. (2006). Comparing the post–earnings announcement drift for surprises calculated from analyst and time series forecasts. Journal of Accounting Research, 44(1), 177–205.
  3. Han, B., & Zhou, Y. (2016). Institutional trading infrastructure and the Post-Earnings-Announcement Drift. Journal of Financial Economics, 121(2), 292–315.
  4. Arnott, R. D., Harvey, C. R., & Markowitz, H. (2019). A backtesting protocol in the era of machine learning. Journal of Financial Data Science, 1(1), 61–71.
  5. Bailey, D., Borwein, J. M., Lopez de Prado, M., & Zhu, Q. J. (2016). Pseudo-Mathematics and Financial Charlatanism. Notices of the AMS, 63(5), 458–471.
  6. de Prado, M. L. (2018). Advances in Financial Machine Learning. Wiley.